
Introduction
In today’s data-driven world, R has emerged as one of the most powerful programming languages for statistical computing, data analysis, and machine learning.
As an open-source language, R provides an extensive ecosystem of packages and libraries that make it a top choice for data scientists, statisticians, and analysts.
But why is R so popular? What makes it indispensable in data science? And how can you leverage R for your analytical projects?
In this article, we will explore:
✅ Key features of R for data science
✅ Essential R packages for data manipulation, visualization, and machine learning
✅ Real-world applications of R in top companies
✅ Visual examples (charts, diagrams, and code snippets) to enhance understanding
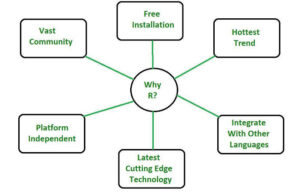
Why R for Data Science?
Data science involves extracting insights from raw data, and R provides a rich statistical and graphical environment to achieve this. Below are some compelling reasons why R is a go-to tool for data professionals:
1. Extensive Statistical Modeling Support
R was built by statisticians, for statisticians. It offers a comprehensive suite of statistical techniques, including:
• Regression analysis (linear, logistic, polynomial)
• Hypothesis testing (t-tests, ANOVA, chi-square)
• Time-series forecasting (ARIMA, exponential smoothing)
• Bayesian inference
📊 Example: A linear regression model in R:
R
model <- lm(Sales ~ Advertising + Price, data = marketing_data)
summary(model)
2. Powerful Data Visualization
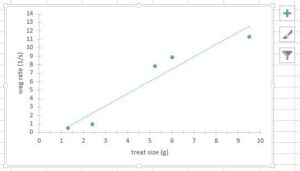
R’s ggplot2 is one of the most advanced data visualization libraries, enabling stunning and interactive plots.
📈 Example: A ggplot2 scatter plot with trendline:
R
library(ggplot2)
ggplot(mtcars, aes(x = wt, y = mpg)) +
geom_point() +
geom_smooth(method = “lm”)
Output:
Watch on YouTube
3. Seamless Data Wrangling with dplyr
The dplyr package (part of the tidyverse) simplifies data manipulation with intuitive functions:
• filter() – Select rows based on conditions
• select() – Pick columns
• mutate() – Create new variables
• group_by() + summarize() – Aggregate data
📋 Example:
R
library(dplyr)
sales_data %>%
filter(Region == “North”) %>%
group_by(Product) %>%
summarize(Total_Sales = sum(Sales))
4. Integration with Databases & Big Data Tools
R can connect to SQL databases (PostgreSQL, MySQL), NoSQL (MongoDB), and even Hadoop/Spark via:
• RJDBC / RODBC (for SQL)
• mongolite (for MongoDB)
• sparklyr (for Apache Spark)
Diagram of R’s data connectivity options
5. Machine Learning & AI Capabilities
R supports advanced machine learning through packages like:
• caret (Classification And Regression Training)
• mlr (Machine Learning in R)
• randomForest (for ensemble learning)
• xgboost (for gradient boosting)
🤖 Example: Training a random forest model:
R
library(randomForest)
model <- randomForest(Species ~ ., data = iris)
print(model)
Decision tree visualization
Top R Packages for Data Science
Package Use Case Example Functionality
ggplot2 Data Visualization geom_point(), geom_bar()
dplyr Data Wrangling filter(), mutate(), summarize()
tidyr Data Cleaning pivot_longer(), drop_na()
shiny Interactive Dashboards shinyApp(ui, server)
caret Machine Learning train(), predict()
lubridate Date-Time Manipulation ymd(), floor_date()
plotly Interactive Graphs ggplotly()
Bar chart comparing package downloads from CRAN
Real-World Applications of R in Top Companies
1. Google (Flu Trends Analysis)
Google uses R to predict flu outbreaks based on search queries.
flu trends visualization from Google
2. Facebook (Social Network Analysis)
Facebook applies R for user behavior analytics and network graph modeling.
Social network graph example
3. Uber (Dynamic Pricing & Visualization)
Uber leverages R Shiny for real-time pricing dashboards.
4. IBM (Watson AI & Analytics)
IBM integrates R into Watson Studio for predictive modeling.
IBM Watson workflow diagram
Conclusion & Next Steps
R is indispensable for data science due to its:
✔ Statistical prowess
✔ Visualization capabilities
✔ Data manipulation efficiency
✔ Machine learning integration
Want to learn R for data science? Check out the embedded video in this article and stay tuned for my upcoming video tutorials where I’ll demonstrate hands-on R coding for:
• Data cleaning & wrangling
• Advanced visualizations
• Machine learning models